pandoc-plot is a pandoc
filter to generate figures from code blocks in documents. This page is
generated from Markdown using
pandoc-plot, so you can get a sense of what is
possible.
pandoc-plot currently supports the following plotting
toolkits (installed separately):
matplotlib: plots using the matplotlib Python library;plotly_python : plots using the plotly Python library;plotly_r: plots using the plotly R librarymatlabplot: plots using MATLAB;mathplot : plots using Mathematica;octaveplot: plots using GNU Octave;ggplot2: plots using ggplot2;gnuplot: plots using gnuplot;graphviz: graphs using Graphviz;bokeh: plots using the Bokeh visualization library;plotsjl: plots using the Julia
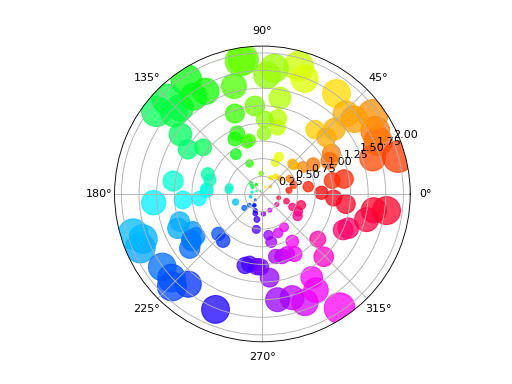
Plots.jl package;plantuml: diagrams using PlantUML;d2: plots using D2;asy: plots using Asymptote;mermaid: plots using the Mermaid tookit.Here’s the simplest way to create a figure in Markdown:
```{.matplotlib}
import numpy as np
import matplotlib.pyplot as plt

np.random.seed(23)

# Compute areas and colors
N = 150
r = 2 * np.random.rand(N)
theta = 2 * np.pi * np.random.rand(N)
area = 200 * r**2
colors = theta

fig = plt.figure()
ax = fig.add_subplot(111, projection='polar')
c = ax.scatter(theta, r, c=colors, s=area, cmap='hsv', alpha=0.75)
```
which renders like so:
pandoc-plot supports interactive plots for certain
toolkits. Here’s an example using bokeh:
```{.python .bokeh format=html caption="Move around in the plot by using your mouse. This gallery example was modified from [here](https://docs.bokeh.org/en/latest/docs/gallery/hex_tile.html)."}
import numpy as np

from bokeh.plotting import figure
from bokeh.transform import linear_cmap
from bokeh.util.hex import hexbin

np.random.seed(23)

n = 50000
x = np.random.standard_normal(n)
y = np.random.standard_normal(n)

bins = hexbin(x, y, 0.1)

p = figure(title="Interactive plotting with Bokeh", tools="wheel_zoom,pan,reset", match_aspect=True, background_fill_color='#440154', width=550, height=550)

p.grid.visible = False

p.hex_tile(q="q", r="r", size=0.1, line_color=None, source=bins,
           fill_color=linear_cmap('counts', 'Viridis256', 0, max(bins.counts)))

```
Move around in the plot by using your mouse. This gallery example was modified from here. (Source code)